


Intro
In the present day, when the population is constantly growing, when we are faced with epidemics and various diseases, modern health systems are under great pressure, especially the first line of health systems - patient triage. The efficiency and accuracy of patient triage are of fundamental importance for the provision of timely and adequate care. PriorityCare is an innovative solution that uses machine learning algorithms to improve and speed up the patient triage process, ensuring that patients receive exactly the care they need based on their condition (symptoms and other medical findings). This solution comes to the fore especially in today's healthcare environment where demands for urgent and routine care are increasing, making the need for an efficient triage system more important than ever. By properly and accurately optimizing triage, PriorityCare aims to prevent bottlenecks that are often a problem for healthcare facilities, which directly affects the system to respond better and more efficiently to a greater influx of patients, and ultimately providing better care to each individual patient.
The problem we are solving
The primary problem that is at the center of PriorityCare's focus is the optimal triage of patients in emergency situations and in overburdened health care facilities, which as a consequence: can have a delay in the treatment of patients with critical health symptoms as well as inefficient use of health care resources. By facing this challenge, it can contribute to reducing the threat to patients' lives and reducing additional pressure on healthcare workers and the entire healthcare system. A problem with conventional triage methods. they often depend on subjective judgments that may vary among healthcare professionals and may not take into account all available patient data. This inconsistency can result in delays and inadequate quality of patient care, which puts the health system in an unenviable position.
Approach
PirorityCare uses machine learning algorithms that allow the analysis of all patient data, such as: current symptoms, medical history, vital signs - all in order to assess urgency. In the event that there is historical patient data, it would be a significant advantage for ML algorithms to identify patterns and correlations that may not be apparent at first to healthcare professionals, which would ultimately result in better accuracy and greater speed in patient triage. What is the biggest advantage of the system is that it is designed to constantly learn and adapt, which would eventually result in its predictive abilities becoming better and more accurate. In addition, the dynamic learning process enables the adaptation of triage protocols in real time, thus ensuring that the entire system responds precisely to emerging health situations, thus ensuring professionalism and relevance in the rapid delivery of health care.
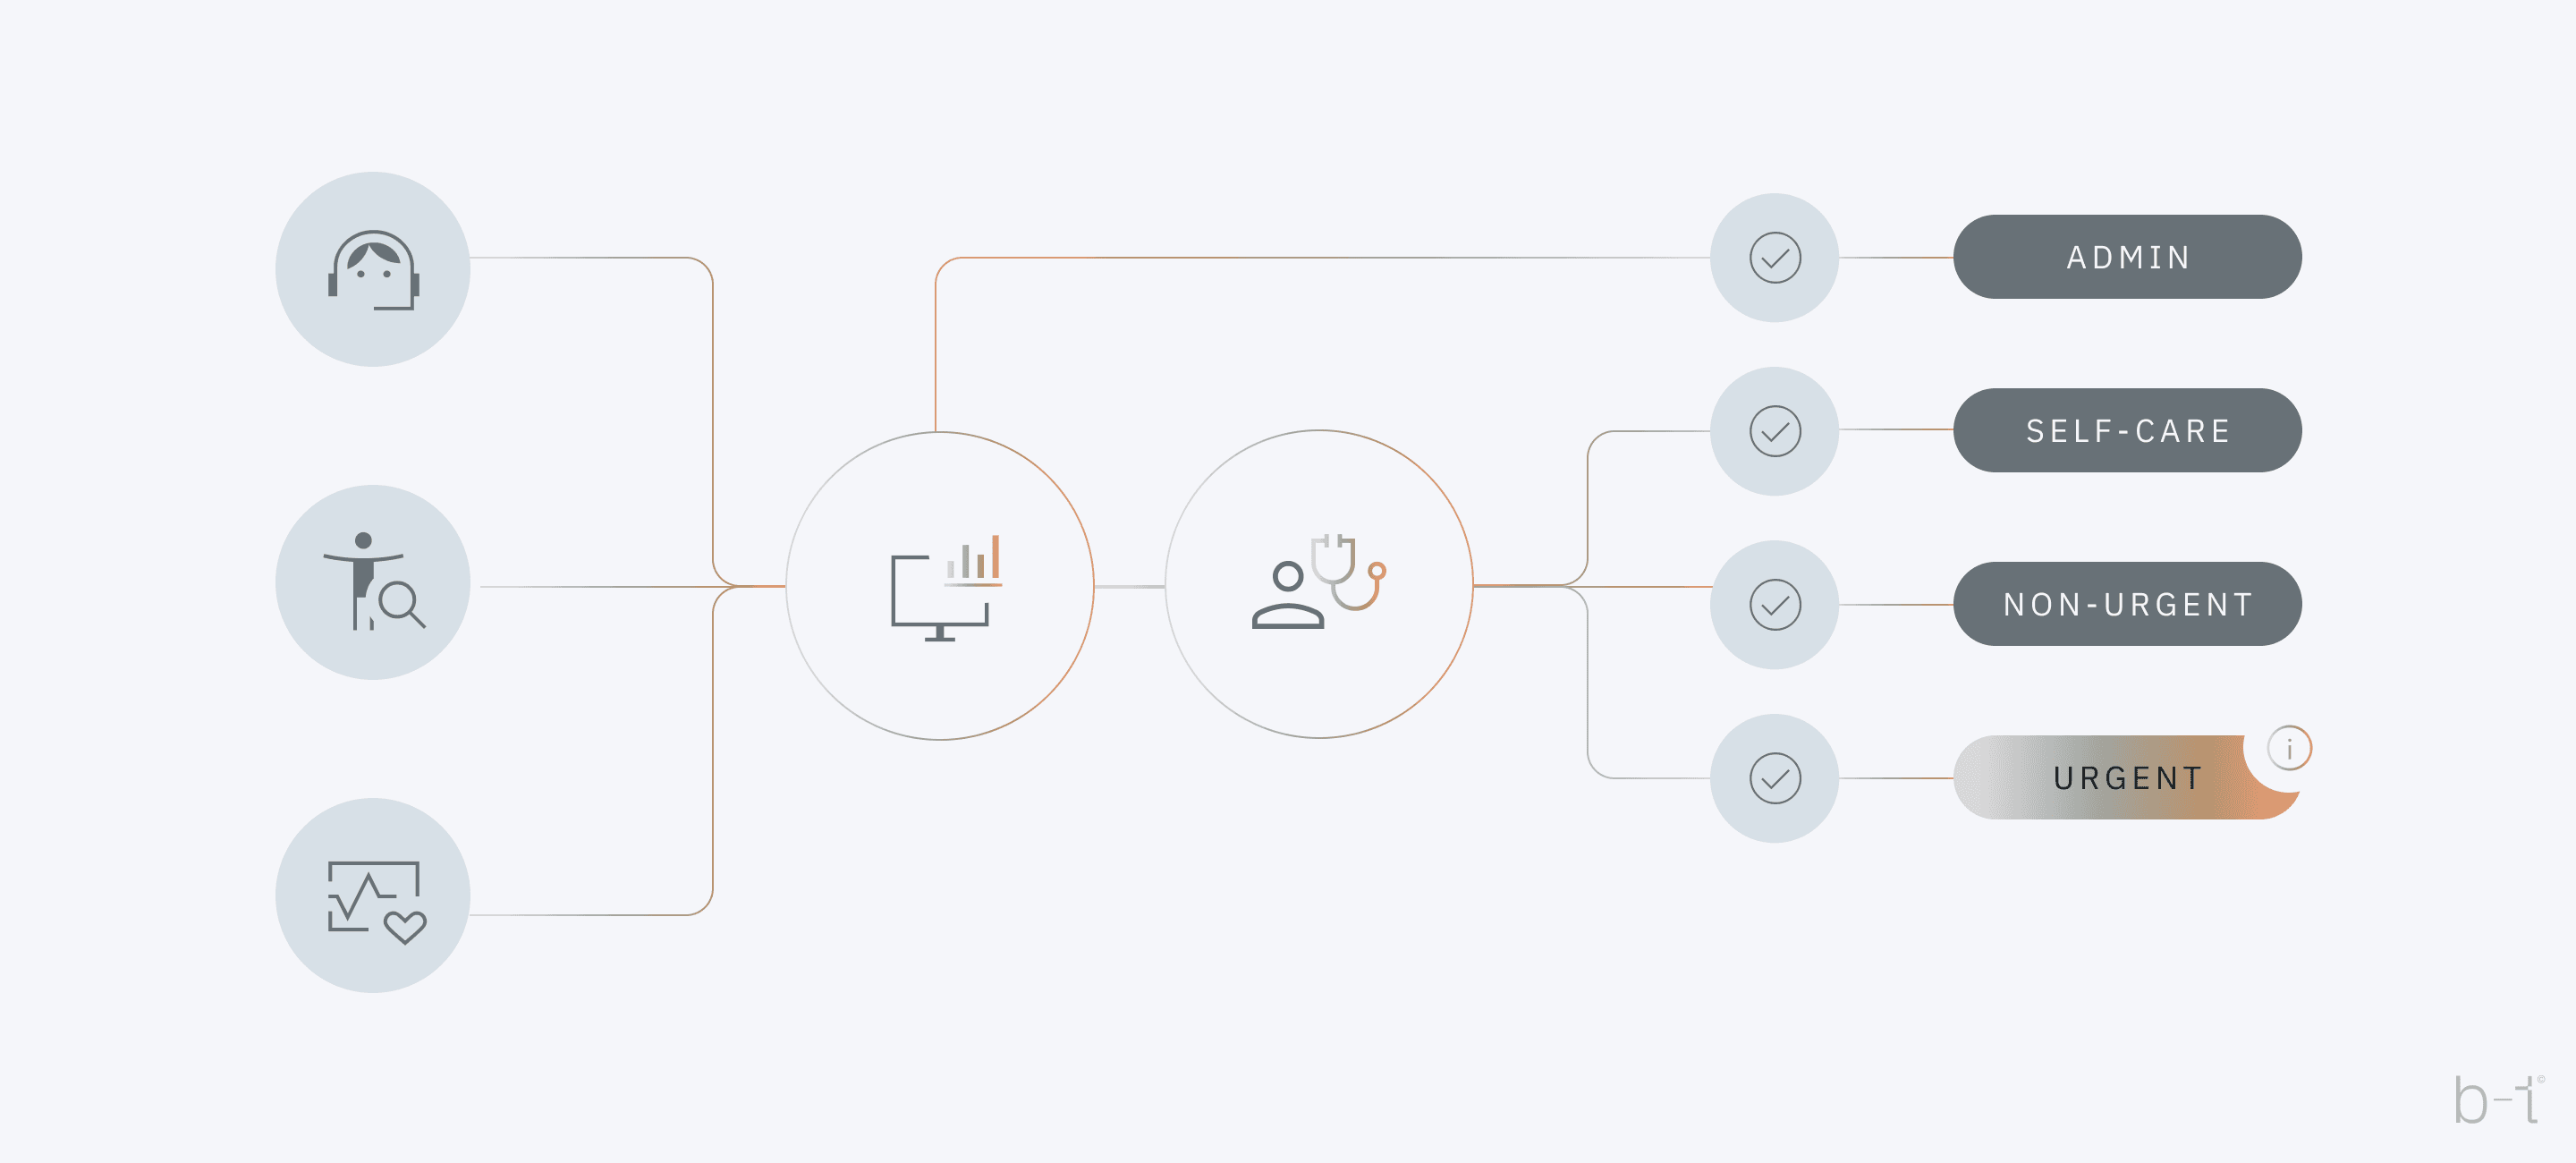 Figure 1: Workflow diagram for PriorityCare
The previous image (Figure 1) depicts workflow diagram for Priority Care, illustrating how an intelligent machine learning framework can enhance patient triage. At the very entrance to the healthcare facility, there is a system - whether in the form of an application or a healthcare worker who collects the medical data of each patient individually. The collected data is sent to a central processing unit where the analysis and decision-making process is carried out using machine learning algorithms.
Specifically, in this case, the system categorizes patients into three main categories, represented by: self-care, non-urgent, urgent. Also, there is an additional category: "admin", which represents additional administrative processing or monitoring, which may indicate that these patients require additional monitoring or additional administrative attention. The "Self-care" category indicates those patients who do not need professional supervised medical assistance, while the "non-urgent" category indicates that these patients may need medical assistance, but not immediately. While the "urgent" category indicates cases that require urgent medical intervention.
Collecting data
When we talk about the use of data in business, one of the key steps is recognizing the value of already existing, often unused information within the organization. Here we propose an approach that starts with the idea of 'use existing data', rather than a 'we need new information' approach. This philosophy leads us to the first stage where we focus on converting accumulated data into a semi-structured or structured form, which is the foundation for further analysis and value extraction.
ETL processes (Extract, Transform, Load) play a key role in this transformation. It’s allow raw data from various sources to be extracted, cleaned and converted into a format suitable for analytics and decision making. Through ETL, we achieve that unorganized data becomes available, secure and relevant for business needs.
This process is not just a technical task but a strategic move that positions organizations to be 'data-driven' in their decisions.
By implementing this approach, organizations become more agile, able to quickly react to changes in the market and improve operational efficiency. In addition, ETL processes enable the establishment of a robust foundation for advanced analytics, including machine learning and artificial intelligence.
After establishing the entire ETL process for the successful implementation of a system like "PriorityCare", which uses intelligent machine learning models to improve the patient triage process, the data that would be useful (in an ideal scenario) for the machine learning algorithms are as follows:
Data types required for PriorityCare:
Basic identification data:
- Name (or pseudonym for anonymity)
- Date of birth
- Gender
Demographic data:
- Ethnicity
- Socio-economic status
Medical history:
- Chronic diseases
- History of hospitalizations
- Drug allergies
Current symptoms and condition:
- Onset of symptoms
- Symptom severity (e.g., mild, moderate, severe)
- Specific symptoms (e.g., chest pain, dizziness)
Vital signs:
- Temperature
- Blood pressure
- Pulse rate
- Oxygen saturation
Laboratory test results:
- Complete blood count (CBC)
- Biochemical tests
- Other specific tests relevant to symptoms
Data on previous visits and treatments:
- Date of last visit
- Reason for visit
- Recommended or prescribed treatment
Social and behavioral factors:
- Smoking, alcohol, drug use
- Level of physical activity
After extracting the key information that was previously enumerated, the next essential step is to transform this information into a tabular and structured format that is suitable for further analysis and machine learning algorithms. This means organizing the data into rows and columns, where each row represents a unique encounter with the patient, and each column represents a corresponding variable: such as: symptoms, disease history, etc. This kind of structuring helps in maintaining data integrity, ensuring consistency in different data sets, which is important for subsequent predictive analyses.
Table 1: Example dataset for Machine Learning model
| Patient ID | 1 | 2 | 3 |
|---|---|---|---|
| Age | 45 | 30 | 65 |
| Gender | M | F | M |
| Chronic Diseases | Diabetes | None | Hypertension |
| Symptoms | Chest pain | Headache | Dizziness |
| Symptom Severity | High | Medium | Low |
| Temperature | 36.5°C | 37.0°C | 36.8°C |
| Blood Pressure | 130/85 | 120/80 | 150/90 |
| Pulse Rate | 90 | 80 | 70 |
| Oxygen Saturation | 98% | 97% | 96% |
| Previous Treatments | N/A | Analgesics | Antihypertensives |
| Smoking | Yes | No | No |
| Alcohol | No | Yes | No |
| Output (Priority) | High | Medium | Low |
The preceding table (Table 1) allows the machine learning algorithm to learn patterns and relationships between different variables and triage priorities, where “Output (Priority)” is used as the target variable for training the algorithm, and the other columns are used as input features. One of the key requirements for machine learning to be able to classify patients according to priority for triage is a large amount of detailed patient data (as shown in Table 1, only with many more rows). Some of the conditions that our dataset should satisfy are the following:
- Volume: To build an accurate and reliable model, typically thousands to tens of thousands of patient records will be required. The more diverse and comprehensive the data set, the better the model can learn and generalize to new, unprecedented cases.
- Diversity: The dataset should be as diverse as the patient population it serves, including a wide range of ages, genders, ethnicities, medical histories, symptoms, and outcomes. This diversity ensures that the ML model does not develop biases toward certain groups and can accurately predict priorities across the entire spectrum of patients.
- Quality: Beyond size and diversity, the quality of the data is crucial. This means ensuring that the data are accurate, consistently recorded, and include all relevant information. Missing or erroneous data can lead to inaccuracies in the model's predictions. This part will be covered by the ETL process.
- Privacy and Security: It's critical to maintain the privacy and security of patient data throughout this process. Data anonymization and encryption techniques can help protect sensitive information while still allowing the data to be used for training ML models.
What if we do not have tabular data?
In case we do not have access to tabular data (as in the case of Table 1), the data is in digital SOAP form instead. As for the SOAP format, it's a standardized method for documenting medical information and patient encounters. SOAP stands for Subjective, Objective, Assessment, and Plan.
- Subjective (S): This part includes information provided by the patient about their symptoms, feelings, perceptions, and personal opinions. For example, a patient might describe the intensity of pain, its location, or any triggers that make the symptoms worse.
- Objective (O): This section records measurable, tangible medical findings obtained during the patient's examination. It includes physical examination results, vital signs, laboratory test results, and imaging studies.
- Assessment (A): This part involves a medical evaluation of the subjective and objective information to form a diagnosis. It may also include a list of differential diagnoses or problems being considered.
- Plan (P ): Here, the treatment plan for the patient is outlined. It can include medications, therapies, further tests for monitoring, self-care instructions, or referrals to specialists.
In our approach, we will proceed under the assumption that the data set in question, specifically the digitized SOAP notes, is readily available within the established database infrastructure. This implies that relevant health data is carefully converted into a digital format that conforms to the SOAP structure, ensuring that each patient's subjective experiences, objective observations, assessment findings and planned interventions are organized and accessible. Such organization facilitates seamless access for healthcare professionals and analysts, enabling efficient data retrieval, which is critical for feeding information into our machine learning models.
The image below shows an example progress note with SOAP sections annotated.
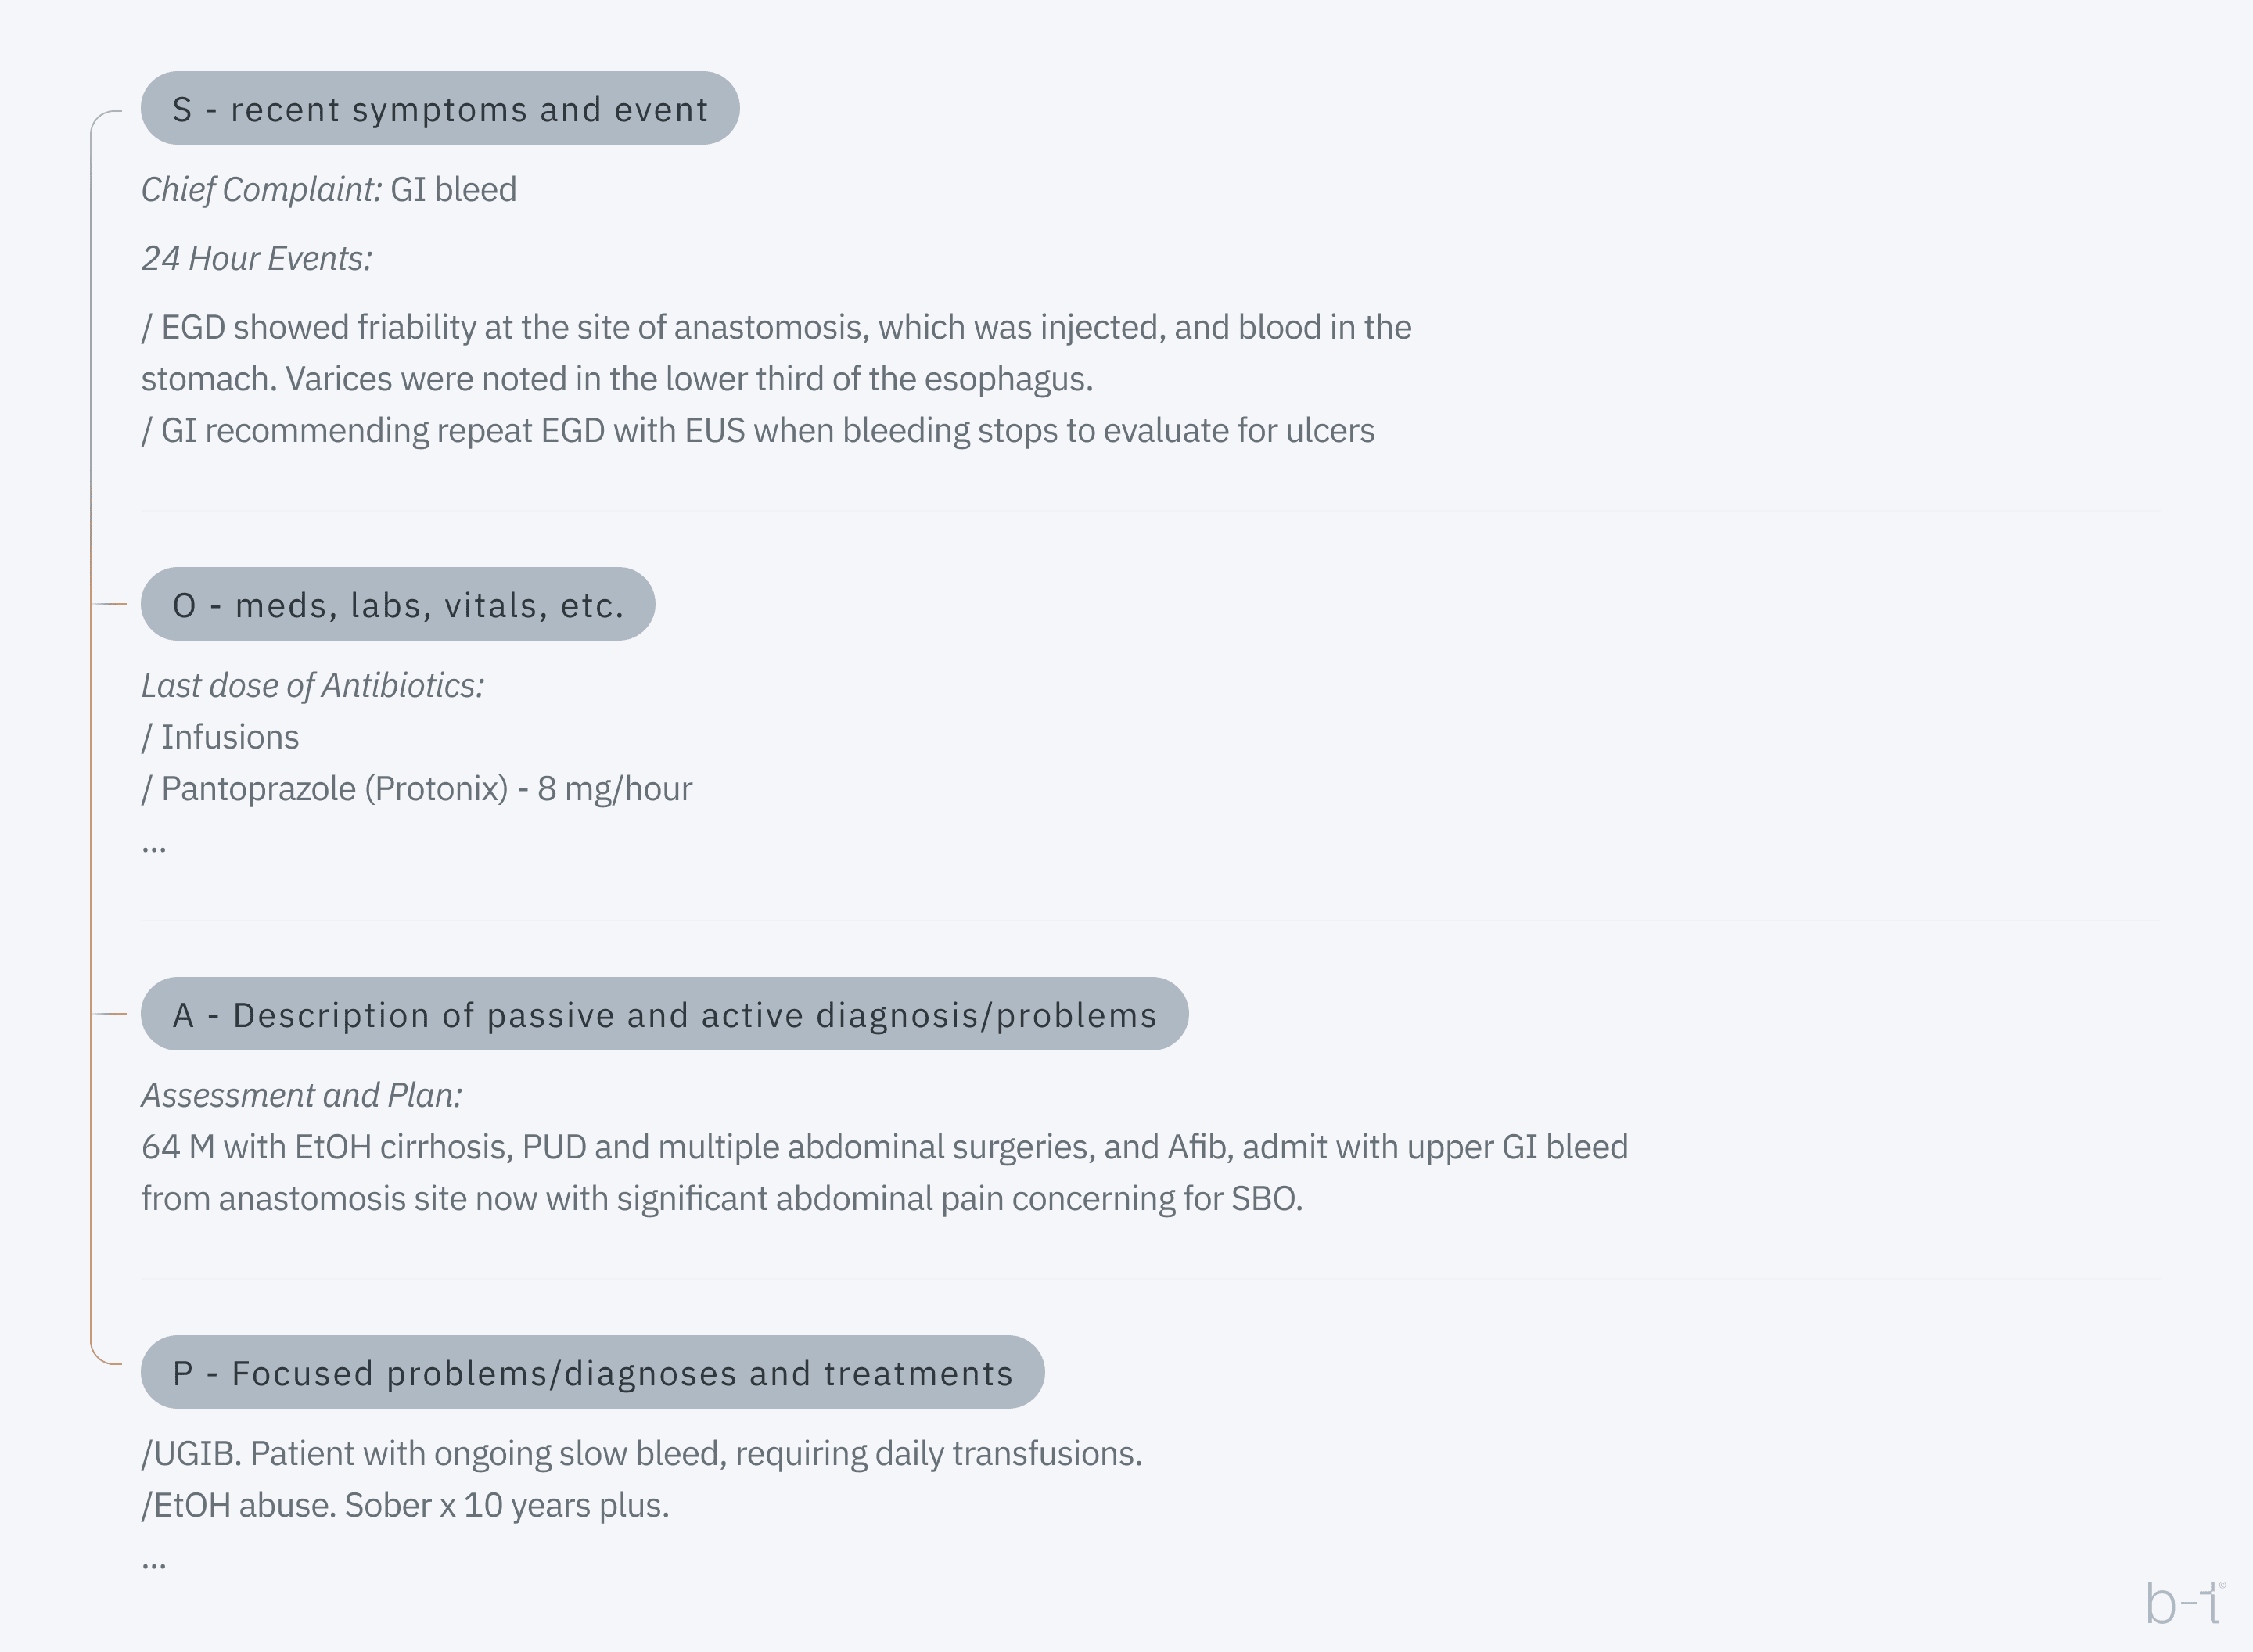 Figure 2: Progress note with SOAP sections
This format allows for quick identification of key information about a patient and their treatment, which is particularly useful in settings where multiple healthcare professionals are involved with their patient, but this approach is not the best for data processing. This type of data has several challenges to transform into a digital format, what is needed is the following:
- Annotating digitized text is critical, including segmenting the text to categorize content into four SOAP sections, and using markup tools to color-code or label these sections for easy identification. Content within these sections is then identified, marking specific medical terms and findings, such as symptoms in the Subjective section or vital signs in the Objectives section.
- Labeling involves assigning labels to each piece of data, such as 'symptom' for 'GI bleeding', preparing the data for machine learning. This systematic labeling creates structured datasets, allowing machine learning models to recognize patterns and assist with tasks such as patient triage.
The image below shows an example of annotation and labeling:
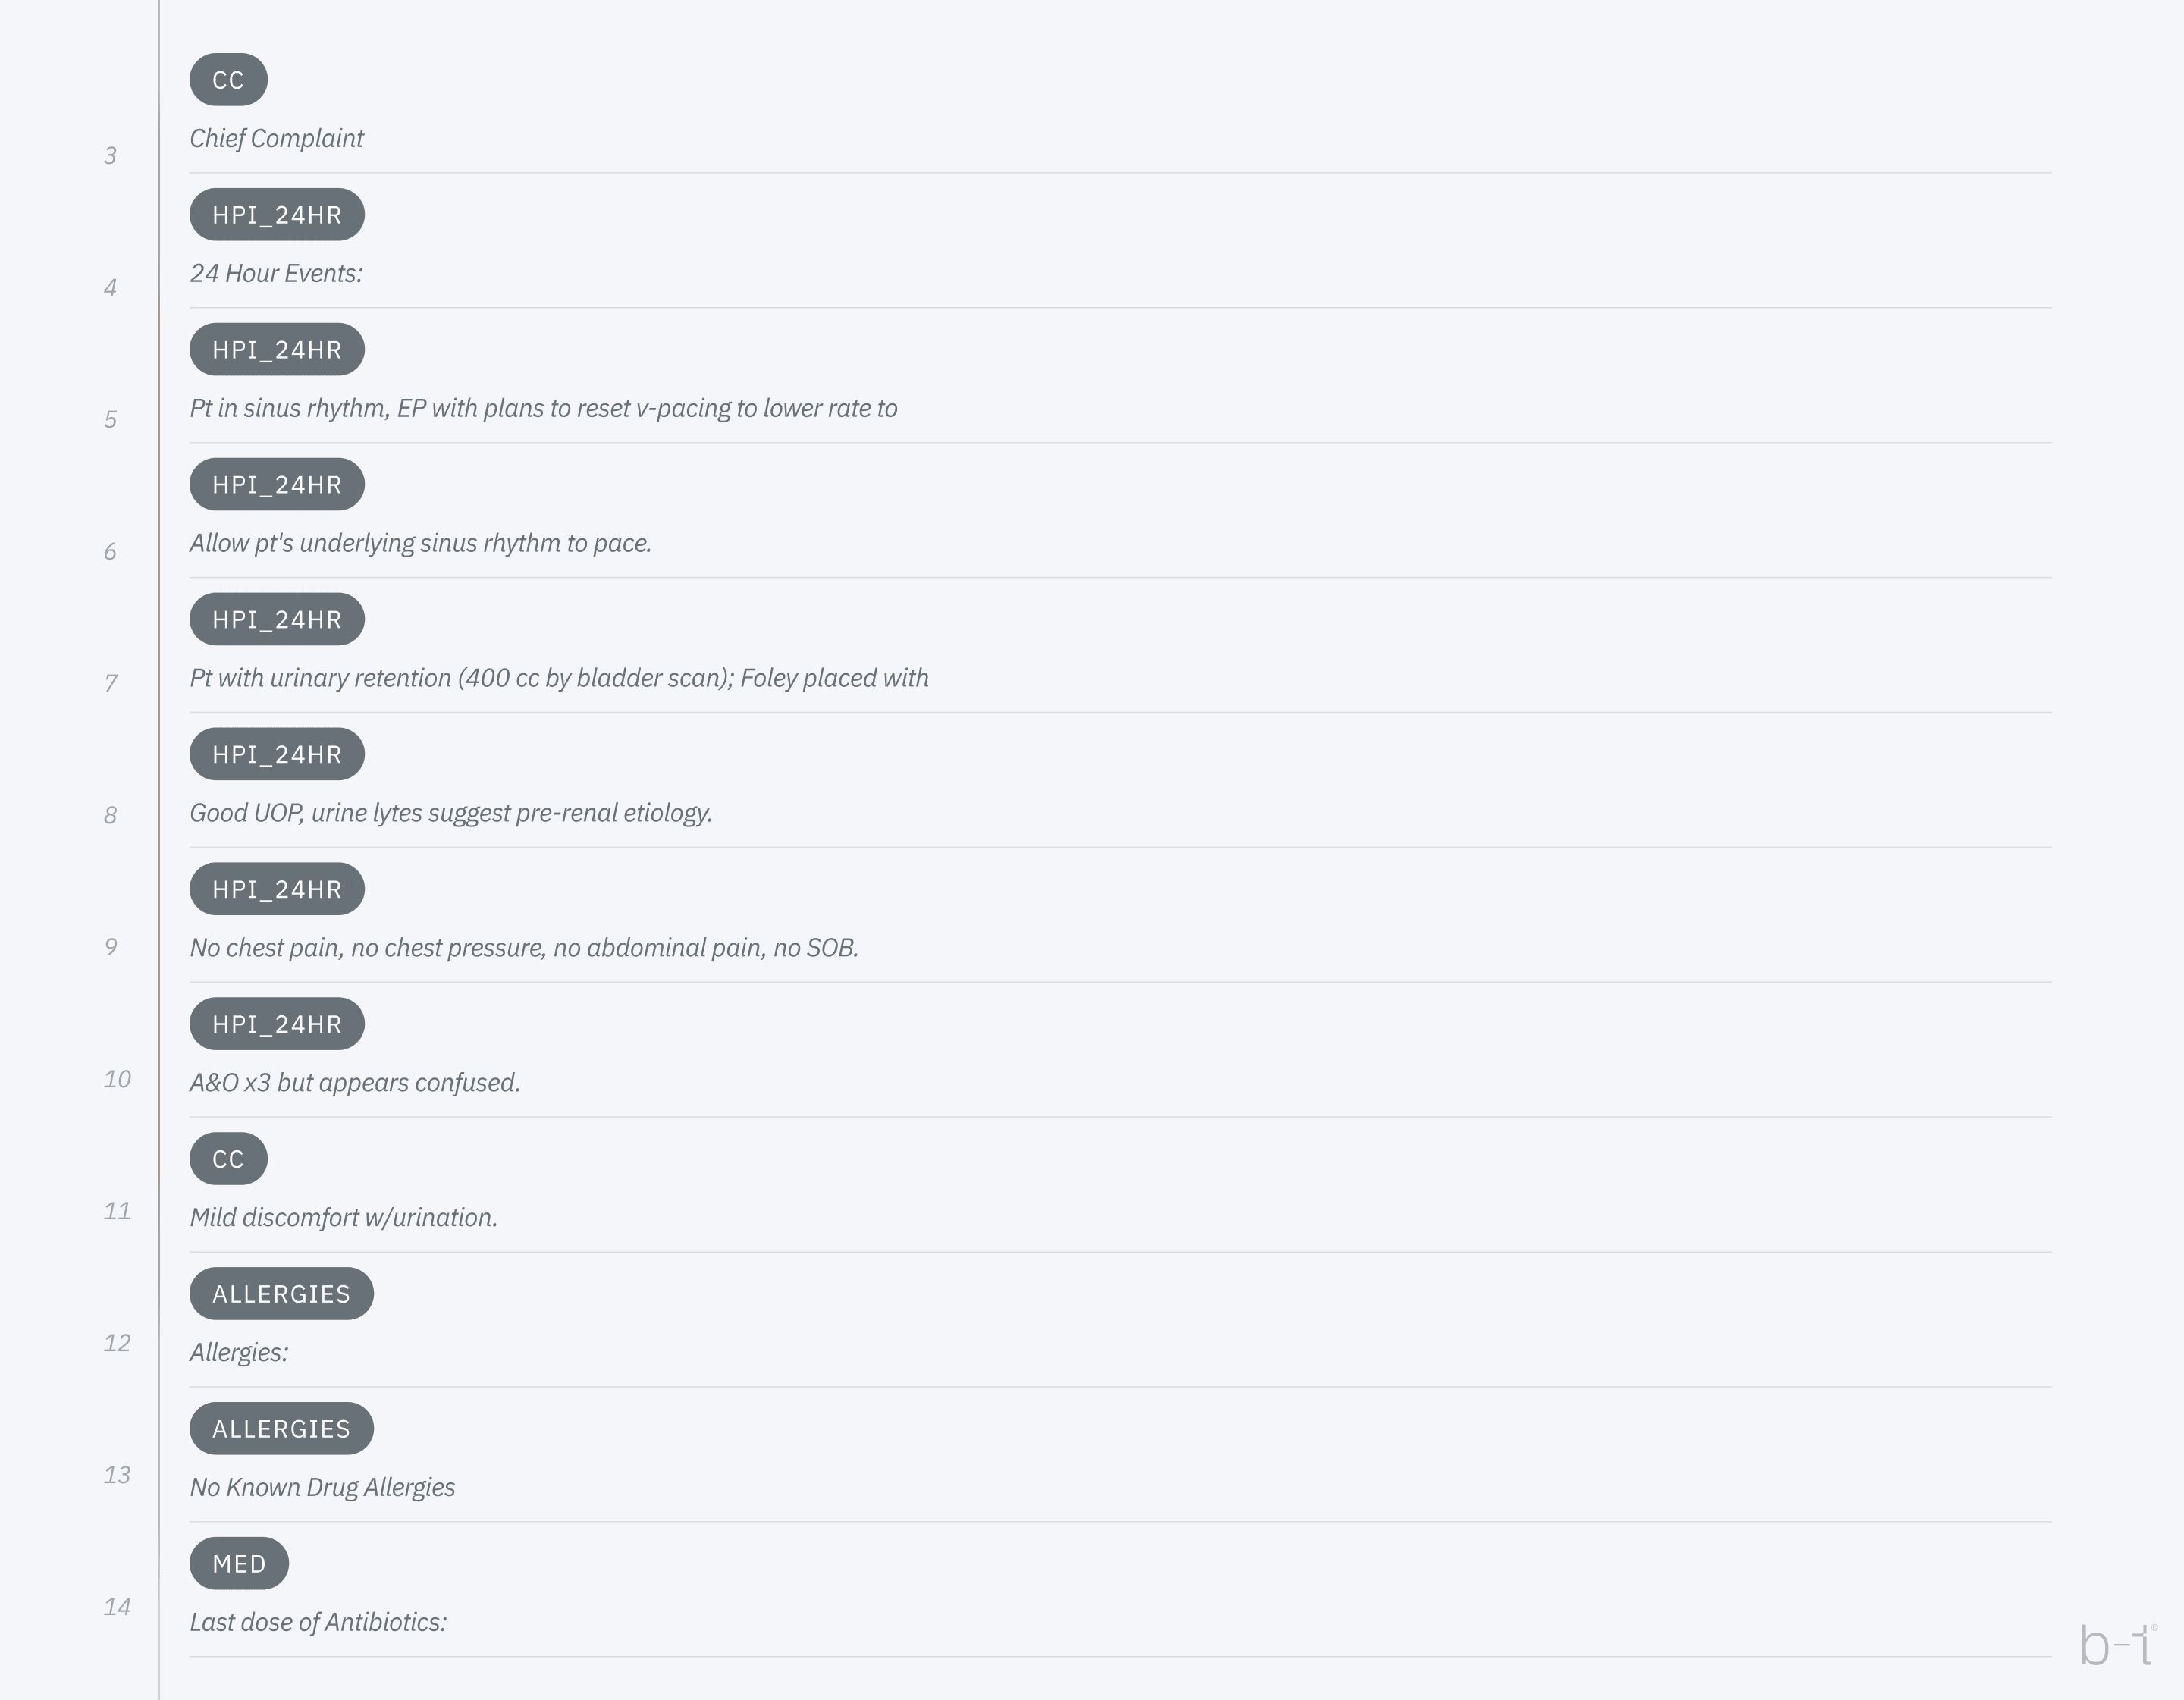 Figure 3: Example of lannotation and abeling
Where the annotated tag is displayed in the table below:
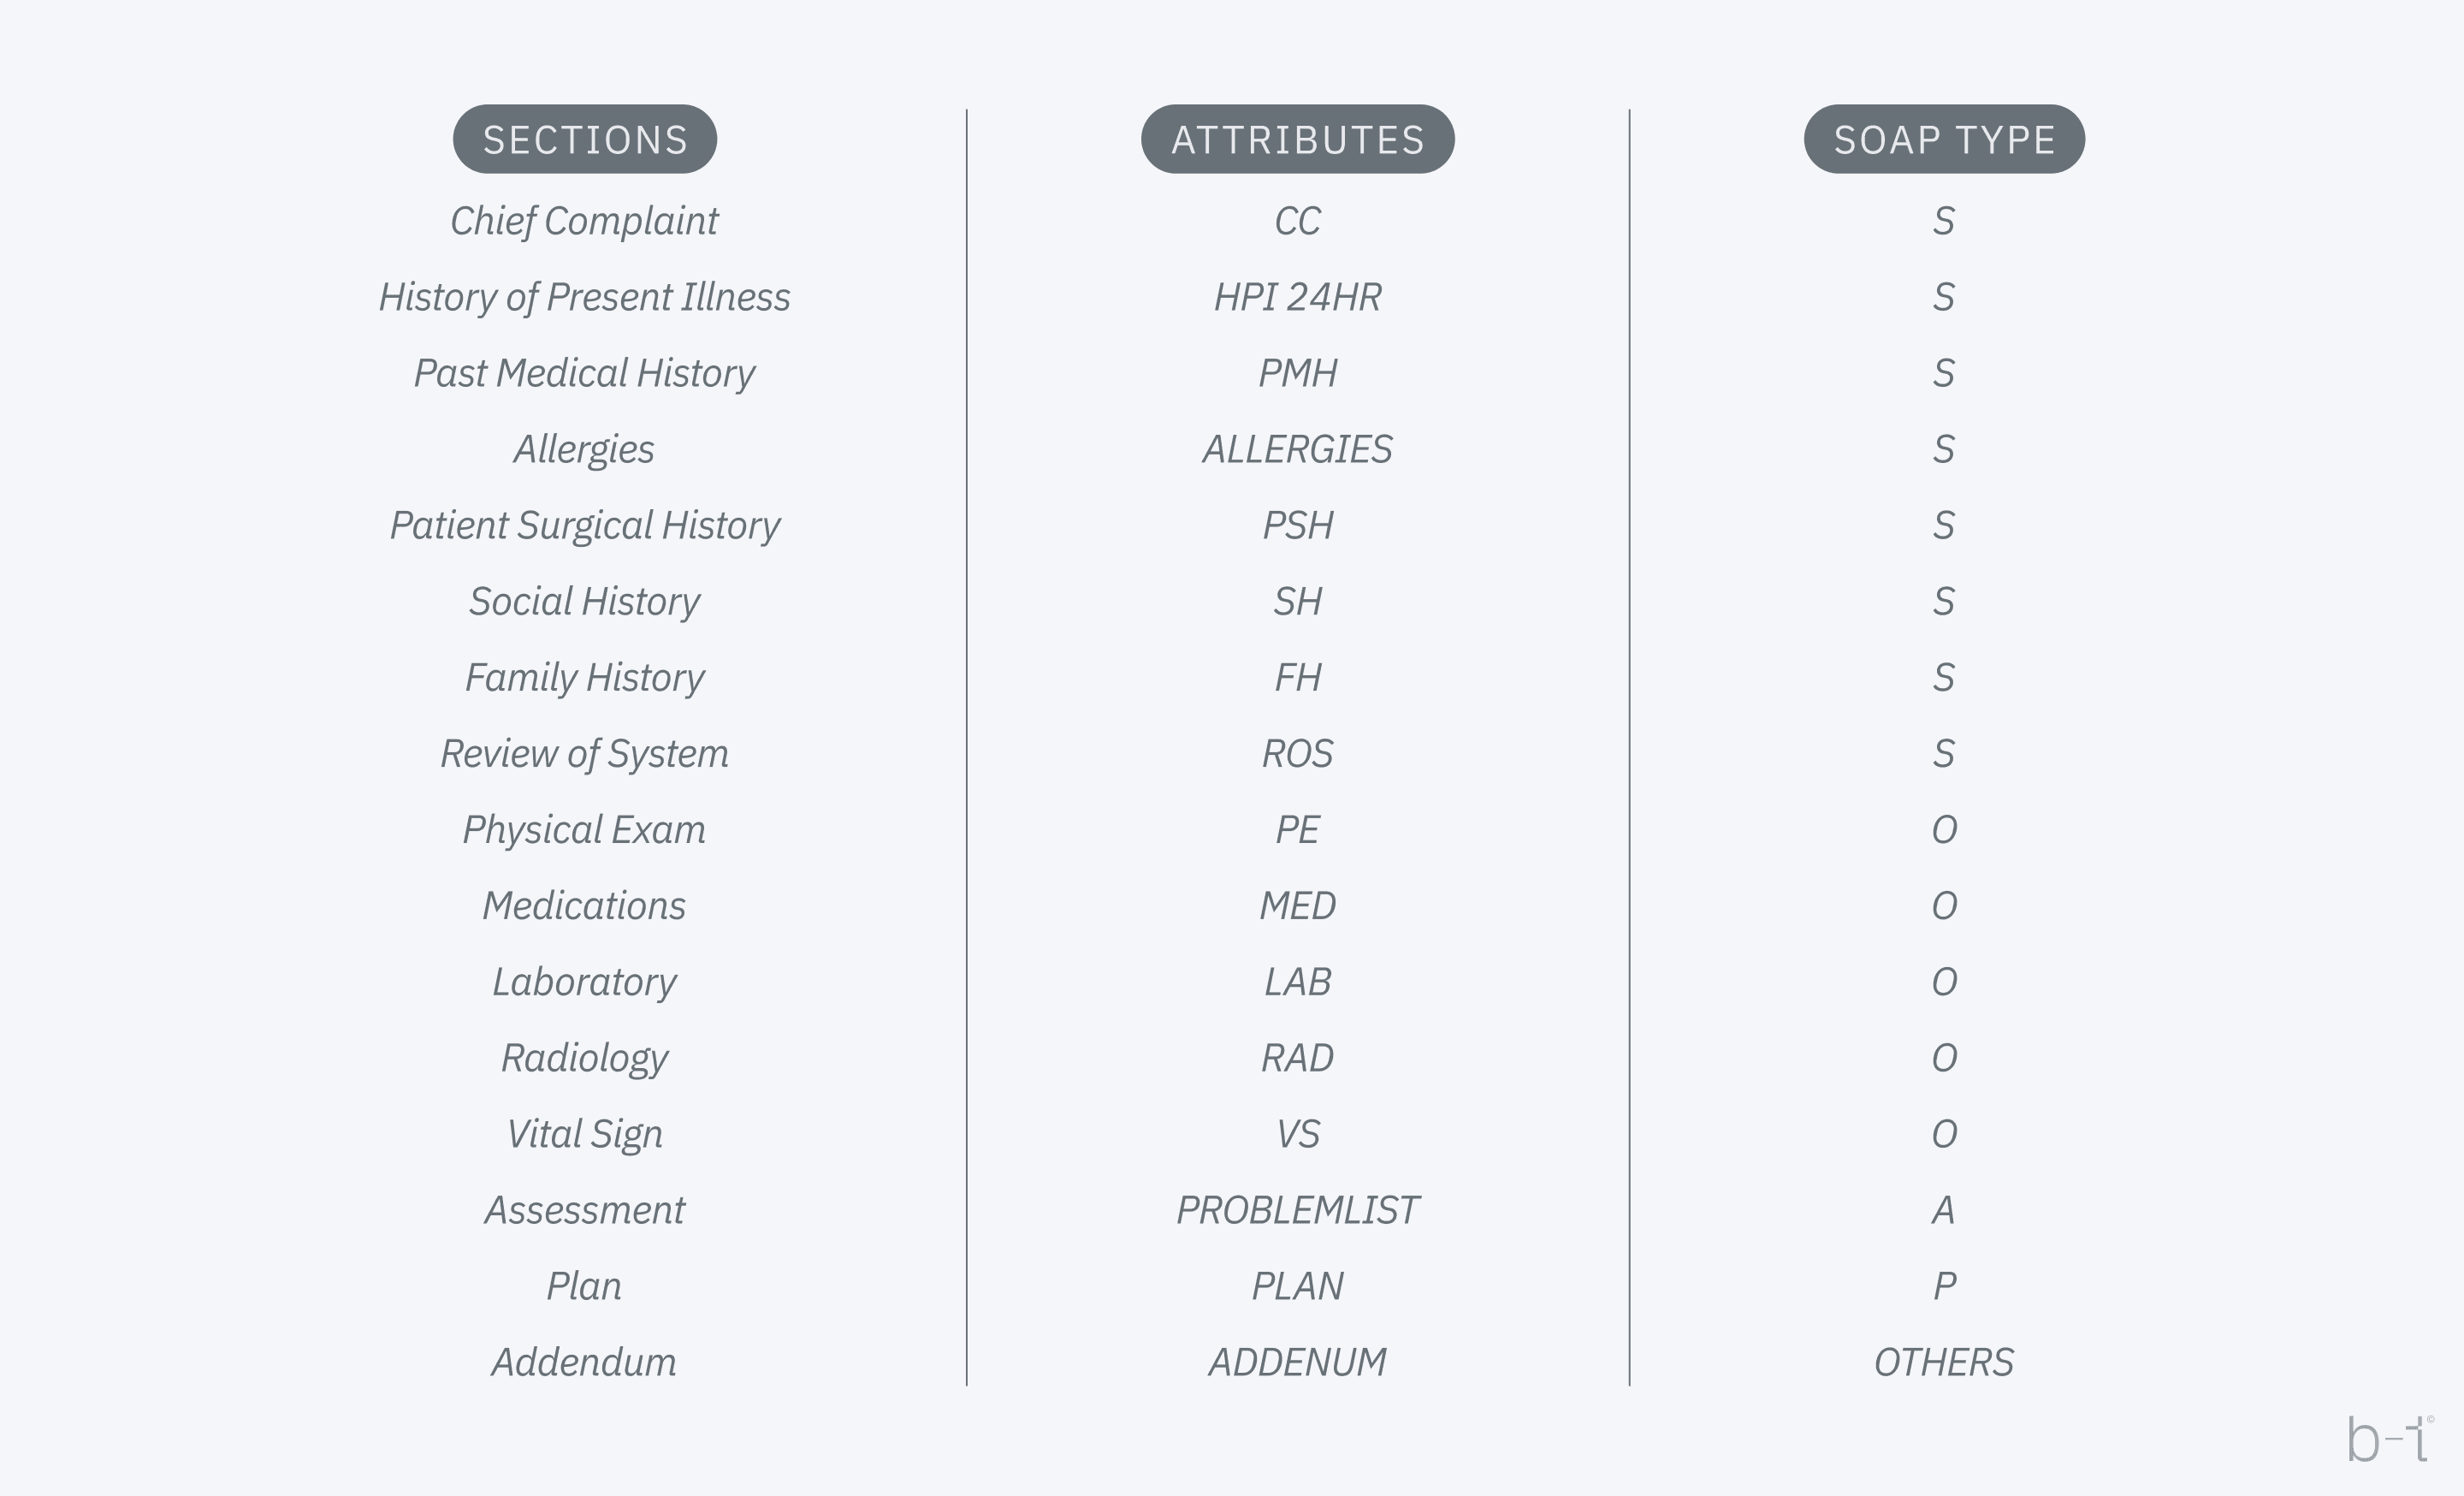 Figure 4: Example of annotated tab
In feature extraction for medical triage, important data points like symptom type and severity, patient history, and vital signs are identified and quantified to form predictive features. Qualitative descriptions are converted into quantifiable metrics, often using severity scales or NLP techniques. Clinical expertise guides the emphasis on critical features like high-risk conditions. Feature engineering may also create composite indicators from multiple data points. For data structuring, these features are then organized into a structured dataset, typically in a table where rows represent patients and columns represent features. This data undergoes cleaning and preprocessing to address inconsistencies or missing values and is formatted to meet the specifications of machine learning models. Commonly, data is saved in a CSV file for flexibility and compatibility with various analytical tools, ensuring that it's ready for model ingestion and subsequent analysis.
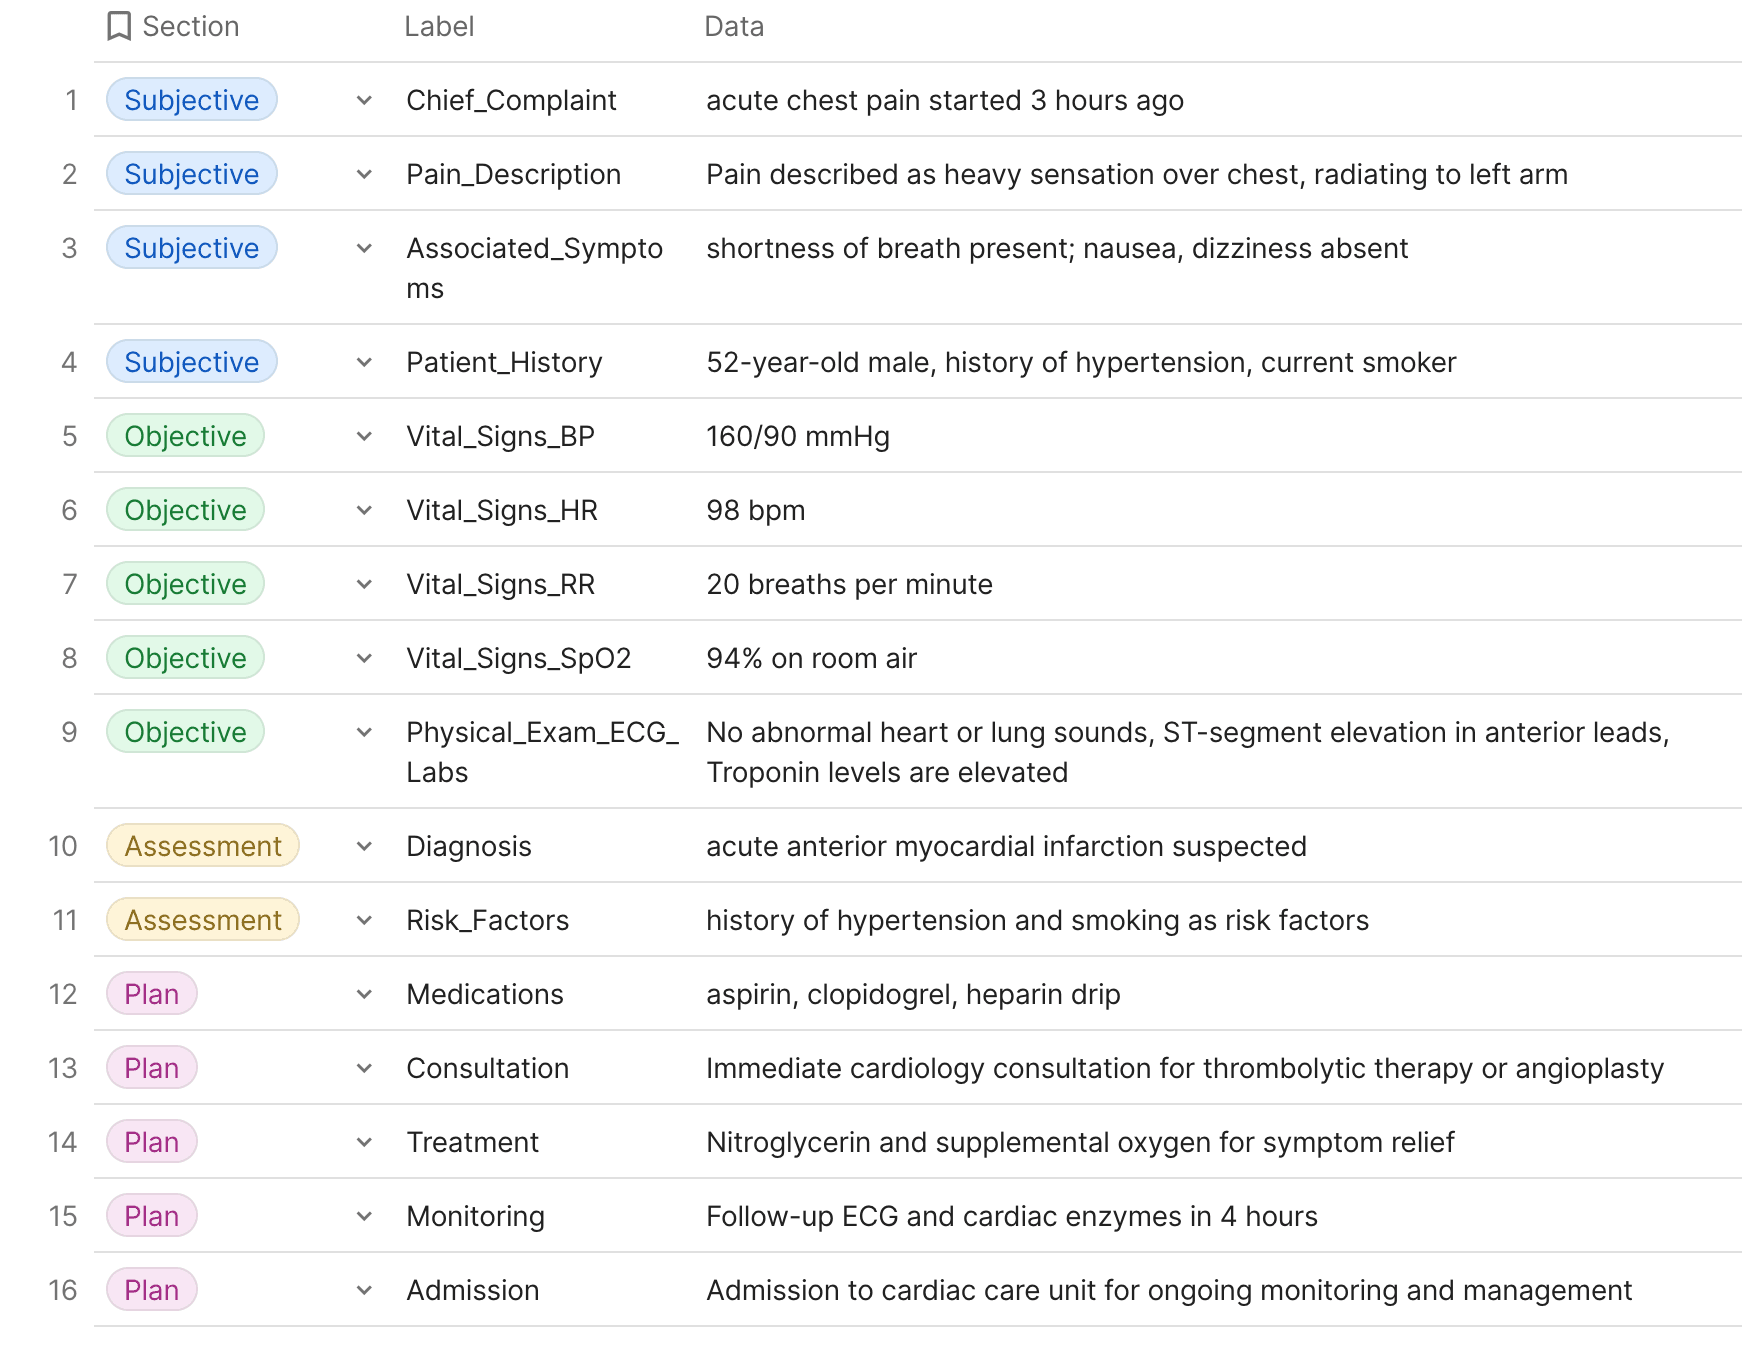
For example suppose we have the following SOAP document type for patient:
S (Subjective): The patient is a 52-year-old male who presents with a complaint of acute chest pain that began 3 hours ago. Describes the pain as a heavy sensation over his chest, radiating to his left arm. Reports associated shortness of breath but denies nausea or dizziness. No previous history of similar symptoms. The patient has a history of hypertension and is a current smoker.
O (Objective): Blood pressure is 160/90 mmHg, heart rate is 98 bpm, and respiratory rate is 20 breaths per minute. Oxygen saturation is 94% on room air. Physical examination reveals no abnormal heart or lung sounds. ECG shows ST-segment elevation in the anterior leads. Troponin levels are elevated.
A (Assessment): The clinical presentation and initial investigations are consistent with an acute anterior myocardial infarction. The patient’s history of hypertension and smoking increases his risk for coronary artery disease.
P (Plan): The patient will be started on aspirin, clopidogrel, and a heparin drip according to the acute coronary syndrome protocol. Immediate cardiology consultation is requested for potential thrombolytic therapy or angioplasty. Nitroglycerin and supplemental oxygen are administered to relieve chest pain and improve oxygenation. A follow-up ECG and cardiac enzymes will be repeated in 4 hours to assess response to treatment. The patient will be admitted to the cardiac care unit for monitoring and further management.
For machine learning purposes, the SOAP note would need to be broken down into labeled and annotated segments. Here’s how the previous example might be processed:
[Subjective] S:
- [Chief_Complaint] CC: "acute chest pain" started "3 hours ago"
- [Pain_Description] PD: Pain described as "heavy sensation" over "chest," "radiating to left arm"
- [Associated_Symptoms] AS: "shortness of breath" present; "nausea," "dizziness" absent
- [Patient_History] PH: "52-year-old male," "history of hypertension," "current smoker"
[Objective] O:
- [Vital_Signs] VS:
- [Blood_Pressure] BP: "160/90 mmHg"
- [Heart_Rate] HR: "98 bpm"
- [Respiratory_Rate] RR: "20 breaths per minute"
- [Oxygen_Saturation] SpO2: "94% on room air"
[Physical_Exam] PE: "No abnormal heart or lung sounds"
[ECG] ECG: "ST-segment elevation in anterior leads"
[Lab_Results] Labs: "Troponin levels" are "elevated"
[Assessment] A:
[Diagnosis] Dx: "acute anterior myocardial infarction" suspected
[Risk_Factors] RF: "history of hypertension" and "smoking" as risk factors
[Plan] P:
[Medications] Meds: "aspirin," "clopidogrel," "heparin drip"
[Consultation] Consult: "Immediate cardiology consultation" for "thrombolytic therapy" or "angioplasty"
[Treatment] Tx: "Nitroglycerin" and "supplemental oxygen" for symptom relief
[Monitoring] Mon: "Follow-up ECG" and "cardiac enzymes" in "4 hours"
[Admission] Adm: Admission to "cardiac care unit" for ongoing "monitoring" and "management"
This structured and annotated data can now be inputted into a machine learning model. Each annotated bracket (e.g., [Chief_Complaint], [Blood_Pressure]) serves as a label for the data it encloses. These labels help the machine learning algorithm to understand the context and relevance of the data points. Before feeding this into a model, the data would typically be further processed into a more condensed format, often numerical, that the algorithm can interpret and learn from.
Table 2: Tabular form of SOAP document type
To prepare the annotated and labeled data for a machine learning model, it's essential to transform qualitative data into a quantitative format that the algorithm can process. This transformation can involve several steps, including encoding categorical variables, normalizing numerical data, and potentially creating new features through feature engineering. Here's an overview of how the data from the provided table might be further processed:
- Encoding Categorical Variables: Many machine learning models require numerical input, so categorical data like symptoms or diagnoses need to be encoded. For example, "Chief_Complaint" could be encoded into multiple binary columns representing common complaints, where "acute chest pain" might translate to 1 in a "chest_pain" column and 0 in others.
- Severity Scores: Symptoms and conditions could be assigned severity scores based on clinical guidelines. For instance, "acute anterior myocardial infarction suspected" might be assigned a high severity score due to its urgent nature.
- Normalization of Numerical Data: Vital signs and other numerical data might be normalized to ensure that all features contribute equally to the model's predictions. For example, blood pressure readings could be scaled to fall within a range of 0 to 1.
- Feature Engineering: New features could be derived from existing data to capture additional insights. For instance, a feature might combine the presence of high-risk conditions and vital sign abnormalities to highlight patients at particularly high risk.
After processing, the dataset might look something like this:
| Patient ID | 1 |
|---|---|
| chestpain | 1 |
| hypertension | 1 |
| smoker | 1 |
| BP_Normalized | 0.8 |
| HR_Normalized | 0.49 |
| RR_Normalized | 0.4 |
| SpO2_Normalized | 0.94 |
| MI_Severity | 9 |
| High_Risk_Score | 8 |
- chest_pain, hypertension, and smoker are binary (0 or 1) encoded features based on the patient's complaints and history.
- BP_Normalized, HR_Normalized, RR_Normalized, and SpO2_Normalized are the patient's vital signs, normalized to a scale of 0 to 1.
- MI_Severity is a score assigned based on the diagnosis's severity, with higher numbers indicating more urgent conditions.
- High_Risk_Score might be a composite score indicating overall risk, calculated from various factors like age, high-risk conditions, and abnormal vital signs.
This condensed, numerical format is suitable for input into machine learning models, which can then learn patterns associated with different outcomes, such as the need for urgent care, potential diagnoses, or the effectiveness of specific treatment plans.
Machine learning
After collecting, cleaning and structuring data, such data is ready for machine learning algorithms. We compare various machine learning models, including decision trees, neural networks, support vector machines (SVM), and ensemble methods like Random Forest and Gradient Boosting, to assess their suitability for the task at hand. This evaluation considers key factors such as accuracy in prediction, model interpretability for human analysts, and computational efficiency, which is critical for processing times and resource allocation, especially in real-time applications.
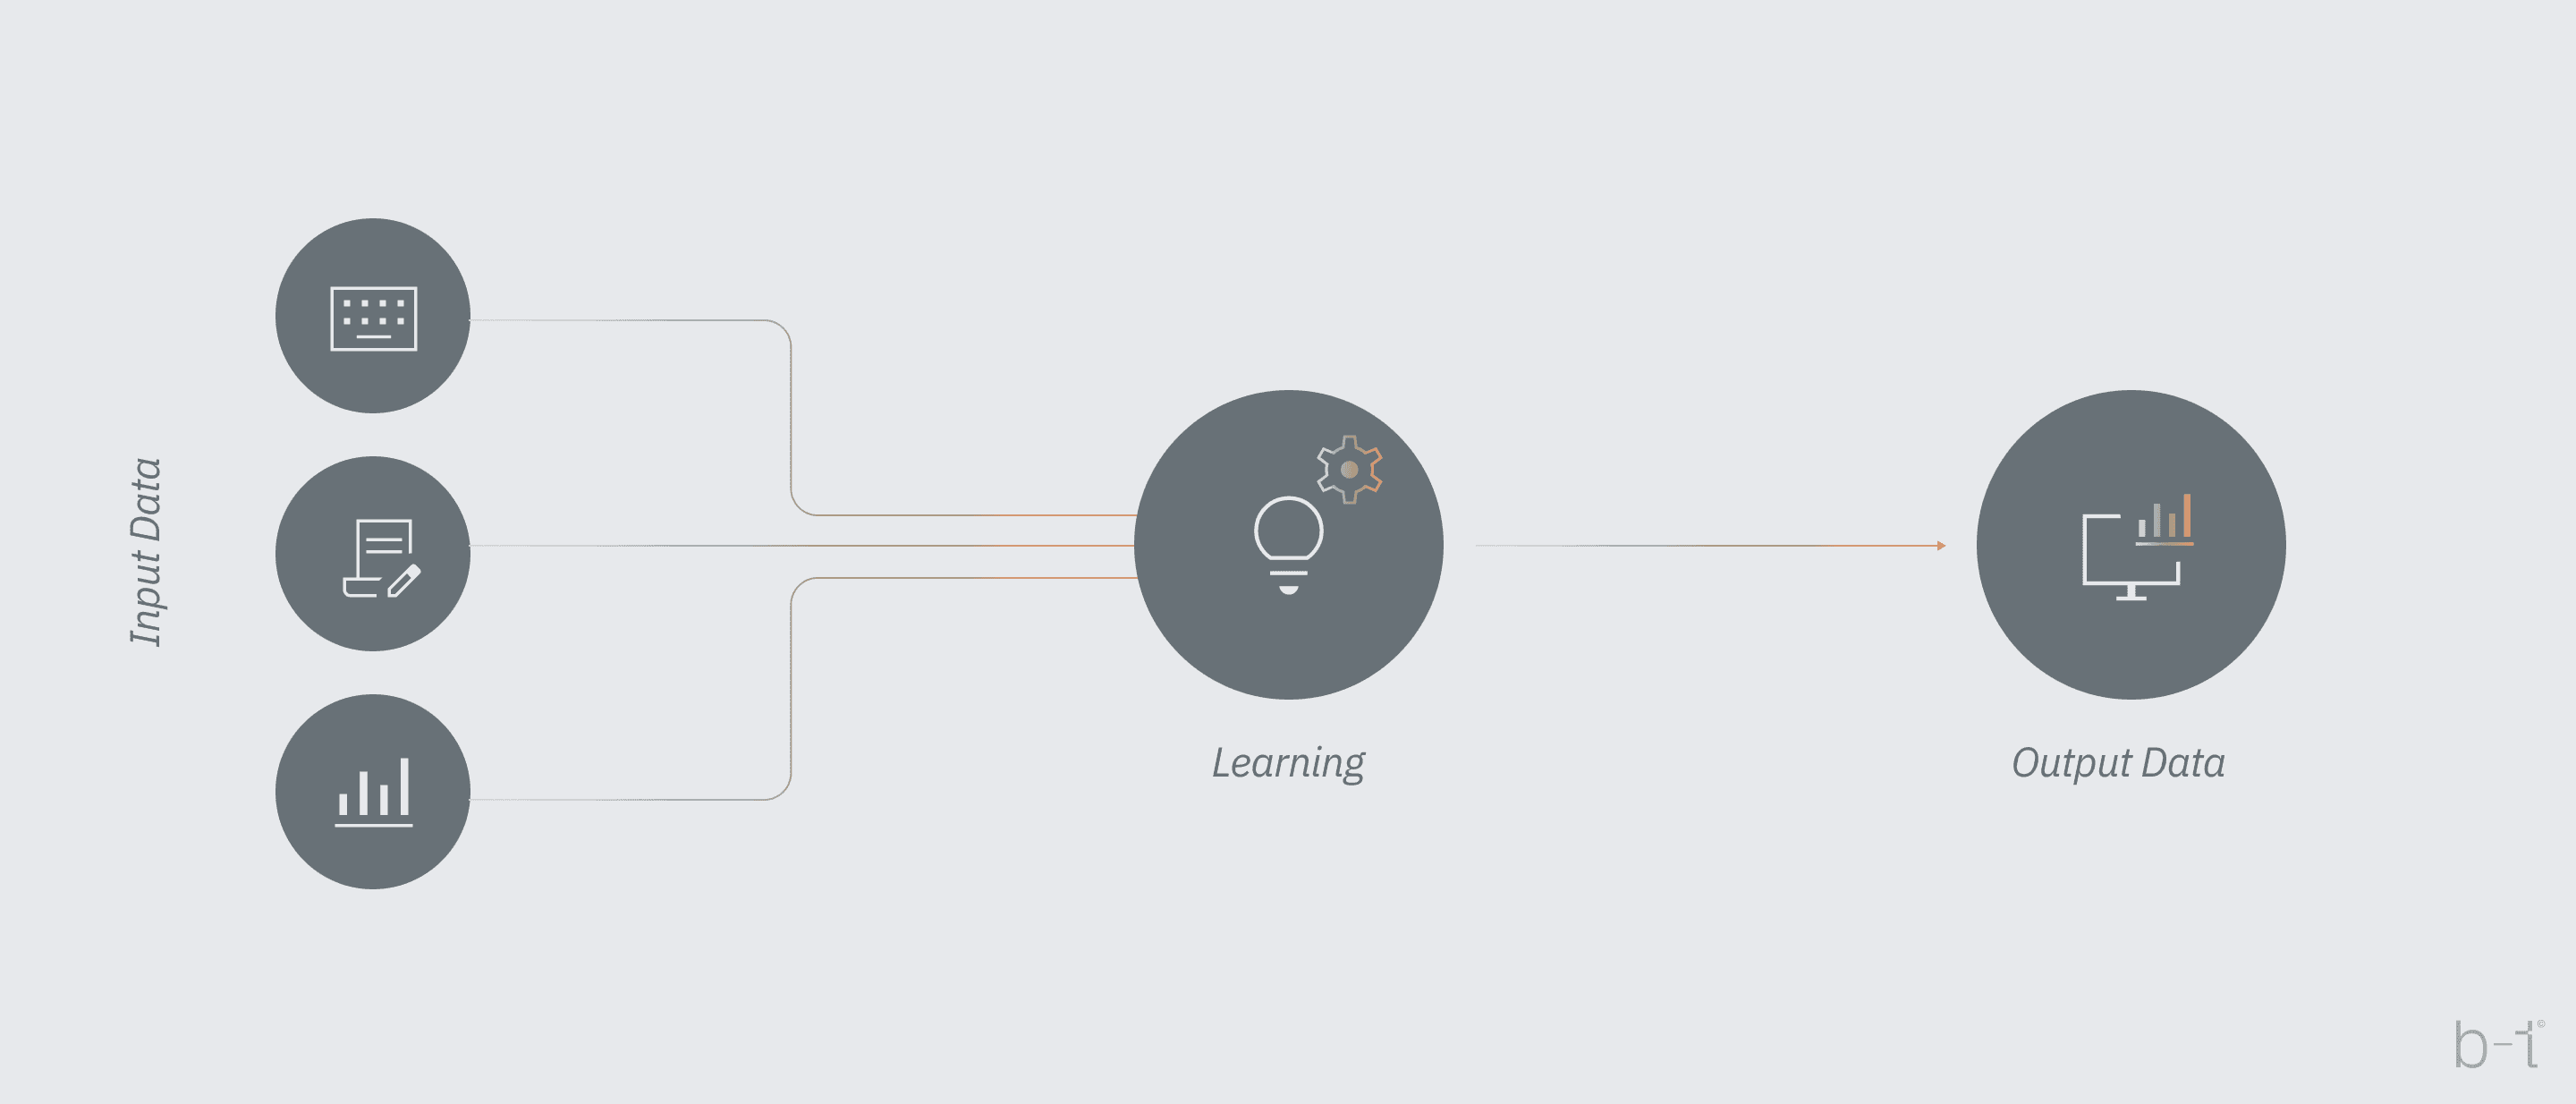 Figure 5: Illustrative process of machine learning: data preparation, machine learning and display of results (output)
Example of classification:
Through the system, data will be taken from the patient which is further sent to the machine learning model (which has previously learned over thousands/tens of thousands of data), for example the input data can be in the following format:
- Patient: A 50-year-old male
- Symptoms: Chest pain, shortness of breath
- Vital Signs: High blood pressure (180/120), rapid pulse (110 beats per minute), decreased oxygen saturation (92%)
- Medical History: Hypertension, smoker
- Laboratory Findings: EKG shows potential signs of a heart attack
The ML algorithm analyzes the input data, comparing it to what it has learned from the historical data set (Table 1 and Table 3). ML model recognizes a combination of symptoms (chest pain and shortness of breath), high blood pressure, rapid pulse, decreased oxygen saturation, and EKG findings as indicators of a potential heart attack.
Based on its analysis, the algorithm classifies this patient as "high priority" for triage. This means that the patient needs urgent medical help.
Conclusion
Machine learning techniques have proven good ability in supporting triage decision-making within hospital settings. These models demonstrated a considerable performance in differentiation between patients with critical outcomes (Mortality and ICU admission) from patients with less critical outcomes (e.g., discharged and hospitalized) in settings. Implementing these models can enhance patient outcomes, reduce waiting times and length of stay, manage hospital resources more effectively and thus reduce overcrowding.